A week ago I added semantic embeddings to my blog posts. Each post gets a high-dimensional vector representation generated by Google's Gemini API, and I store cosine similarity scores between every pair of posts in the database. The natural next step was to visualise these relationships. What I imagined was a living, physics-driven graph where posts cluster together based on how similar they are. Getting there was a longer journey than I expected.
The Similarity Foundation
Before anything visual, the maths. Each blog post has a float[] embedding vector generated by Gemini's text embedding model. The similarity between two posts is their cosine similarity, the dot product of their normalised vectors:
cos(a, b) = (a · b) / (|a| × |b|)
Cosine similarity produces a value in [-1, 1]. Two posts with nearly identical content score close to 1; completely unrelated posts score near 0; posts that are somehow opposites score below 0. I map this to a 0–100 integer: score = round((cos + 1) / 2 × 100), so a score of 50 corresponds to cosine = 0 (no meaningful relationship), and 100 means as similar as possible.
With n posts, there are n(n-1)/2 unique pairs. The similarity scores are precomputed and stored in the database, so using them is only a matter of applying the right filters and retrieving them.
Choosing the Visualisation
The obvious choice for a relationship graph is a force-directed layout, a physics simulation where nodes repel each other like charged particles and edges pull connected nodes together like springs. I started with Three.js, which I was already using for other effects on the site.
Three.js works great for 3D scenes. For a 2D graph it turned out to be the wrong tool. The specific problem was that I wanted the post circles to stay the same size on screen regardless of zoom level, so you can zoom in to read titles without the circles growing to fill the screen. In Three.js with an orthographic camera, objects live in world space and scale with zoom. Counteracting this requires inverse-scaling every mesh whenever the camera changes, which is fiddly.
A plain 2D canvas is a much cleaner fit. Node positions live in world coordinates, but drawing happens in screen space:
worldToScreen(wx, wy) → { x: wx * zoom + panX + w/2, y: -wy * zoom + panY + h/2 }
The circles are drawn at a fixed NODE_RADIUS = 20px at the screen-space position of each node, independent of zoom. Pan and zoom just shift and scale the positions; the circles themselves never change size. The <canvas> also makes edge rendering trivial: draw a line between two screen positions, set lineWidth and strokeStyle, done.
The Physics Model
Imagine each post is a ball with some weight, and the similarity between two posts is an elastic rubber band connecting them. Thicker bands (higher similarity) have greater tension and pull harder. Thinner bands (lower similarity) are loose and barely tug. Balls with no band between them simply push each other away.
That is exactly the force model I implemented.
Repulsion keeps every pair of non-connected nodes apart:
F_repulse = k / d²
This acts like an electrostatic charge, strong at close range and fading with distance.
Springs act along each edge. A spring has a rest length, the distance at which it exerts zero force. Pull the nodes further apart and it attracts; push them closer and it repels:
F_spring = stiffness × (d − rest_length)
The rest length is a function of similarity. The most similar posts (score ≈ 100) have a rest length close to zero, so the band wants them nearly touching. The least similar posts in the graph (score ≈ 50) have a rest length of several hundred world units, so the band is long and loose.
Collision avoidance stops nodes from overlapping by adding a strong push when any two nodes come within a minimum separation distance of each other.
Integration is simple Euler: each step, accumulate forces into velocity, apply damping, update position.
Problem One: The Simulation Never Settled
The first implementation produced a graph that jittered forever. Nodes moved constantly, never reaching a stable state.
The cause is subtle. Repulsion between every pair of nodes is never truly zero. At any finite distance, k/d² is still some small positive number. These tiny forces continuously inject small velocities. The damping (velocity *= 0.85 per step) drains energy, but with Euler integration the system oscillates around its equilibrium rather than converging to it.
I tried raising damping to 0.92, then 0.95. Better, but still not stable. I added a velocity deadzone: if a velocity component drops below 0.04 after damping, snap it to exactly zero. Still not reliable for larger node counts, because the residual forces were still large enough to exceed the deadzone threshold.
The solution was alpha cooling, borrowed from D3's force simulation. Every force in the system is multiplied by a temperature variable alpha that decays geometrically each step:
alpha *= 0.96
if (alpha < 0.004) stop simulation
When alpha approaches zero, all forces approach zero. Forces that once exceeded the deadzone threshold become tiny, the deadzone absorbs them, velocities snap to exactly zero, and the system reaches true rest. This is guaranteed to happen regardless of graph size.
To keep the initial layout good without a jarring animated rearrangement, I run 700 simulation steps synchronously at alpha = 1 before showing the graph. The loading spinner stays up during this computation (it takes well under 100ms for 32 nodes). When the overlay drops, the graph is already settled in its final position.
For interactive dragging, alpha is recharged to 0.5 whenever the user grabs a node, so connected nodes react live to the movement. After release, alpha decays normally and the system re-settles on its own.
Problem Two: Everything Looks Uniformly Distributed
With a stable simulation I had a new complaint: all the circles were roughly the same distance from their neighbours. Posts that were 95% similar looked about as far apart as posts that were 60% similar. The graph looked like a uniform scatter.
My first instinct was to tune the rest length formula. I switched from a linear mapping to a quadratic, then a cubic:
rest_length = MIN_SEP + Math.pow(1 - simNorm, 3) * REST_SPREAD
At simNorm = 0.9 (similarity ≈ 95%), the cubic collapses the rest length to nearly MIN_SEP, so nodes should be almost touching. For simNorm = 0.4 (similarity ≈ 70%), rest length is comfortably large. The graph looked exactly the same.
I then tried making the spring stiffness exponential in similarity:
stiffness = k × exp(simNorm × 3)
This makes the most similar springs roughly 20x stiffer than the weakest ones. I reasoned that even if a node has many weak connections, one or two very strong ones should dominate and pull it into its cluster. Still uniformly distributed.
At this point I started looking more carefully at what was actually happening, and a pattern emerged. Nodes with only one or two connections did get pulled noticeably closer to those connections. But nodes with many connections ended up evenly spread among all their neighbours.
This is the averaging effect, and it is a fundamental property of spring-based force-directed layouts. When a node has ten connections, ten springs pull it in ten different directions. It settles at the centroid of its neighbours, equidistant from all of them. Tweaking rest lengths and stiffness changes the equilibrium distances but not the fact that multi-connected nodes average their positions. No amount of parameter tuning can fix this within a standard spring model.
The Breakthrough
After thinking about it more carefully, I asked: what is actually preventing similar nodes from getting close to each other?
There were two mechanisms:
Long-range repulsion between non-adjacent pairs. This had already been addressed; I was only applying it between nodes that share no edge.
Collision avoidance. This I had left applying to all pairs, including adjacent (similar) ones. When any two nodes came within
MIN_WORLD_SEP = 50world units of each other, a force pushed them apart, including my most similar posts.
The collision term was added to prevent visual overlap, which makes sense for unrelated nodes. But for two posts with 95% similarity, being physically close is exactly what we want. The collision force was directly fighting the spring that was trying to bring them together.
The fix was one line:
// before: collision avoidance for all pairs
if (dist < MIN_WORLD_SEP)
    force += (MIN_WORLD_SEP - dist) * 8 * alpha;

// after: collision only between non-adjacent pairs
if (!adjMatrix[i][j] && dist < MIN_WORLD_SEP)
    force += (MIN_WORLD_SEP - dist) * 8 * alpha;
Adjacent nodes, those sharing an edge, no longer have anything stopping them from reaching their spring rest length. The rest length for sim ≈ 95% is essentially MIN_SEP, nearly touching. Non-adjacent nodes still collide with each other, preventing unrelated circles from piling up.
With this change, the graph finally formed visible clusters. Posts about similar topics pulled into groups. The physics was doing what the physics should do.
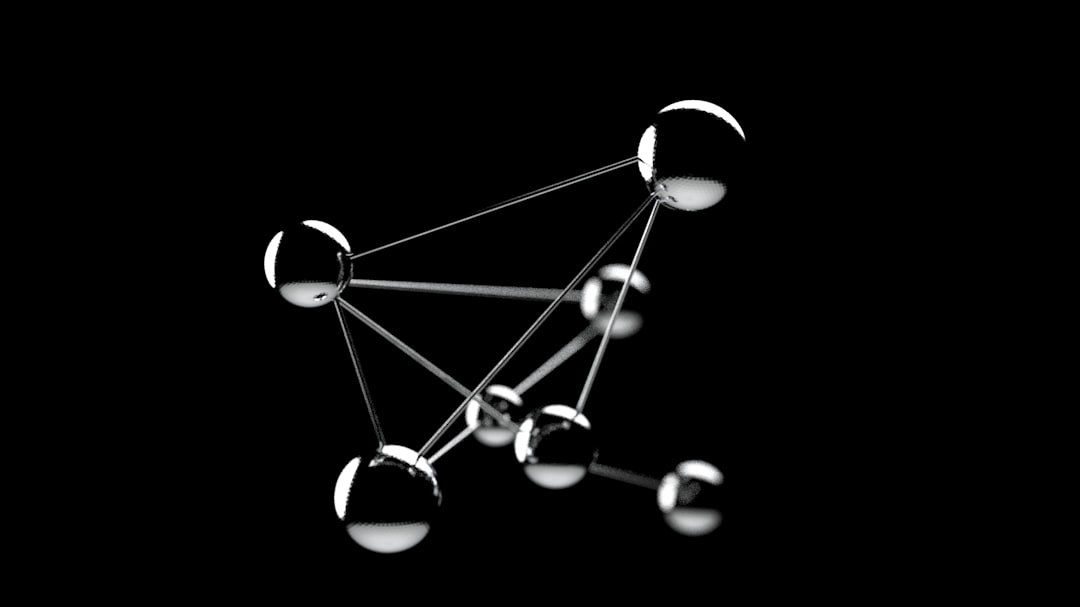
What the Final System Looks Like
The final result is a live 2D canvas simulation graph. Posts are circles with their cover images clipped into them. Edges are drawn with width and opacity proportional to similarity, normalised over the actual min/max range in the current data so the visual contrast is always maximised.
On load, 700 steps of physics run synchronously to find the initial layout, then the loading overlay drops to reveal an already-settled graph. The simulation stays alive: grabbing a node wakes the physics, connected posts visibly react, and the system re-settles a second or two after you let go.
The key insights, in order of discovery:
- Alpha cooling is the correct tool for settling a spring simulation. Damping alone is not enough, because constant forces can always overcome constant damping.
- The averaging effect is fundamental to spring layouts. Exponential stiffness can tilt the balance but cannot fully overcome it.
- Collision avoidance between similar nodes was the hidden culprit. Removing it for connected pairs was the change that finally allowed clusters to form.
It is often the thing you did not add intentionally, the safety mechanism that seemed obvious at the time, that turns out to be the constraint you needed to remove.